It’s been known that some built-in commands in Cobalt Strike are major op-sec no-no’s, but why are they bad? The goal of this post isn’t to teach you “good” op-sec, as I feel that is a bit subjective and dependent on the maturity of the target’s environment, nor is it “how to detect Cobalt Strike”. The purpose of this post is to document what some Cobalt Strike techniques look like under the hood or to a defender’s point of view. Realistically, this post is just breaking down a page straight from Cobalt Strike’s website, which can be found here. I won’t be able to cover all techniques and commands In one article, so this will probably be a two part series.
Before jumping into techniques and the logs associated with them, the baseline question must be answered: “What is bad op-sec?”. Again, this is an extremely subjective question. If you’re operating in an environment with zero defensive and detection capabilities, there is no bad op-sec. While the goal of this article isn’t to teach “good op-sec”, it still has a bias towards somewhat mature environments and certain techniques will be called out where they tend to trigger baseline or low-effort/default alerts & detections. My detection lab for the blog post is extremely simple: just an ELK stack with Winlogbeat & Sysmon on the endpoints, so I’m not covering “advanced” detections here.
Referencing the op-sec article from Cobalt Strike, the first set of built-in commands I’d like to point out are the ‘Process Execution’ techniques, which are run, shell, and pth.
These three commands tend to trigger several baseline alerts. Let’s investigate why.
Shell
When an operator uses the shell command in Cobalt Strike, it’s usually to execute a DOS command directly, such as dir, copy, move, etc. Under the hood, the shell command calls cmd.exe /c.
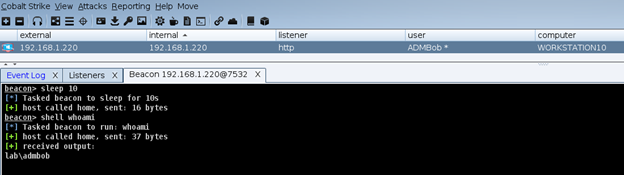
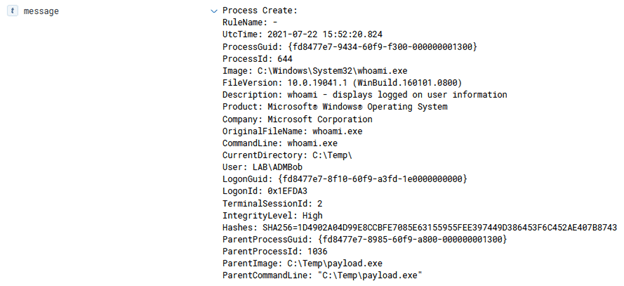
With Sysmon logging, this leaves a sequence of events, all around Event Code 1, Process Create.
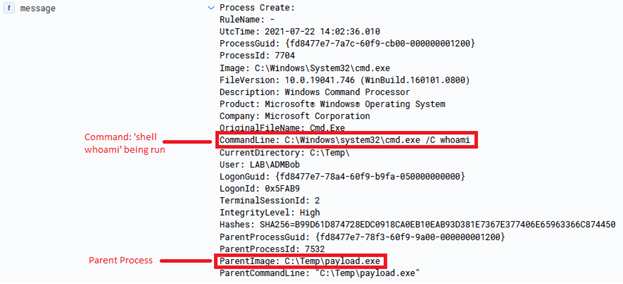
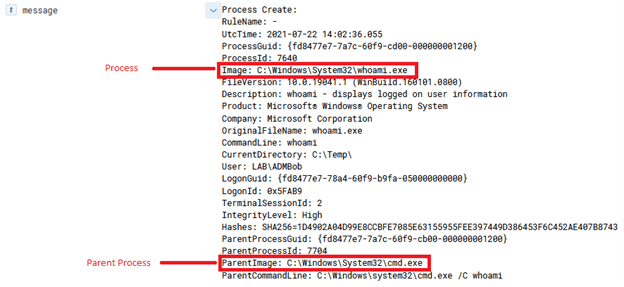
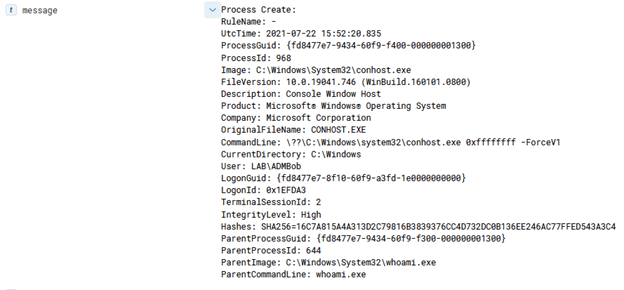
We can see here that the shell command spawns cmd.exe under the parent process. whoami though, is also actually an executable within System32, so cmd.exe also spawns that as a child process. But, before that occurs, conhost.exe is called in tandem with cmd.exe. Conhost.exe is a process that’s required for cmd.exe to interface with Explorer.exe. What is unique, is how Conhost.exe is created:

In this case, Conhost.exe’s arguments are 0xffffffff -ForceV1, which tells Conhost which application ID it should connect to. Per Microsoft:
“The session identifier of the session that is attached to the physical console. If there is no session attached to the physical console, (for example, if the physical console session is in the process of being attached or detached), this function returns 0xFFFFFFFF.”
A goal of op-sec is to always minimize the amount of traffic, or “footprints” that your activities leave behind. As you can see, shell generates quite a few artifacts and it’s common for detections to pick up as cmd.exe /c is seldom used in environments.
PTH
The PTH, or pass-the-hash, command has even more indicators than shell.

From Cobalt Strike’s blog https://blog.cobaltstrike.com/2015/12/16/windows-access-tokens-and-alternate-credentials/:
“The pth command asks mimikatz to: (1) create a new Logon Session, (2) update the credential material in that Logon Session with the domain, username, and password hash you provided, and (3) copy your Access Token and make the copy refer to the new Logon Session. Beacon then impersonates the token made by these steps and you’re ready to pass-the-hash.”
This creates several events.
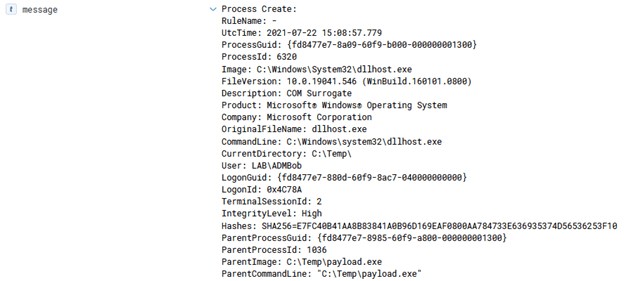
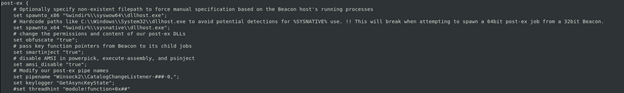
First, the ‘spawnto’ process that is dictated in the Cobalt Strike profile is created, which in my case is dllhost.exe. This becomes a child process of the current process. This is used as a sacrificial process in order to “patch” in the new logon session & credentials.
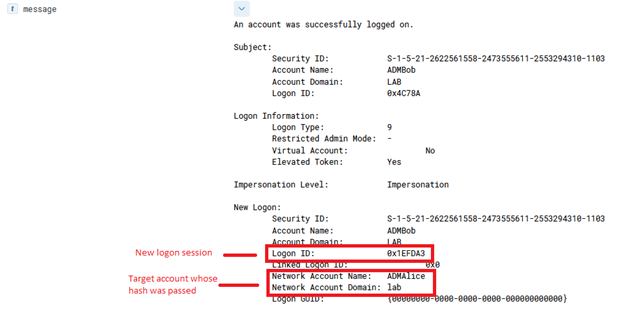
Then a new logon session is created, event ID 4672.

The account then logs on to that new session and another event is created with the ID of 4624.
In this new logon session, cmd.exe is spawned as a child process of dllhost.exe and a string is passed into a named pipe as a unique identifier.

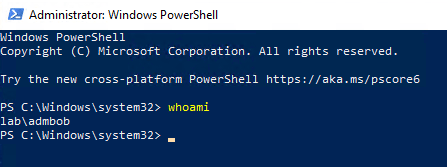
Now, according to the logon session attached to the parent process (dllhost.exe), ADMAlice is the logged in user.
Finally, Conhost.exe is again called since cmd.exe is called. The unique arguments that hide the cmd.exe window are passed into Conhost.

Now, whenever the operator attempts to login to a remote host, the new logon session credential will be attempted first.
Run
The run command is a bit different than PTH and Shell, it does not spawn cmd.exe and instead calls the target executable directly.

Once again though, Conhost is called with the unique arguments.
While the arguments for Conhost aren’t inherently malicious, it is a common identifier for these commands.
execute works similarly to run, however no output is returned.
Powershell
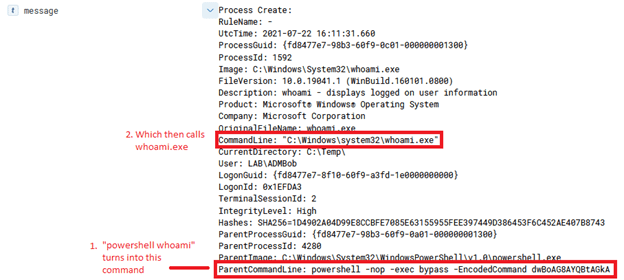
The powershell command, as you can probably guess, runs a command through PowerShell. Powershell.exe is spawned as a child process but the parent PID can be changed with the ppid command. In this case, though, the ppid is kept to the original parent process.
Conhost is again called.

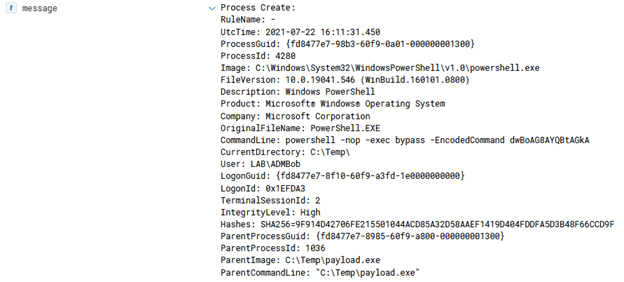
The major problem with the powershell command is that it always adds unique arguments to the command and encodes the command in base64.
This results in a highly signature-able technique as it is not common to see legitimate PowerShell scripts to run as base64 encoded with the -exec bypass flag.
Powerpick
Powerpick is a command that uses the “fork-and-run” technique, meaning Cobalt Strike creates a sacrificial process to run the command under, returns the output, then kills the process. The name of the spawnto process is defined in the Cobalt Strike profile on the teamserver. In my case, it’s dllhost.exe.
When running a powerpick command, such as powerpick whoami, three processes are created: Dllhost.exe (SpawnTo process), Conhost.exe, and whoami.exe.


While Powerpick does not spawn powershell.exe, there’s still op-sec considerations. In this case, this behavior would look somewhat suspicious because of the parent process of ‘whoami.exe’ is ‘dllhost.exe’. Typically, when a user runs ‘whoami’ it’s going to be in the context of cmd.exe or powershell.exe.

The op-sec consideration here is to be aware of what your parent process is and what process you’ll be spawning. Always try to keep parent-child process relationships as ‘normal’ looking as possible. Dllhost.exe with a child process of ‘whoami.exe’ is not normal.
Similarly, these other commands utilize the “fork-and-run” technique and you can expect similar events:
- chromedump
- covertvpn
- dcsync
- execute-assembly
- hashdump
- logonpasswords
- mimikatz
- net *
- portscan
- pth
- ssh
- ssh-key
Spawnas
The spawnas command will create a new session as another user by supplying their credentials and a listener.

Since this is effectively just re-deploying a payload on the host, there’s several events associated with it.
First, a special logon session is created


If the spawnas command is run as an elevated user, the new session will have a split token, meaning two sessions are created: One privileged and another unprivileged.

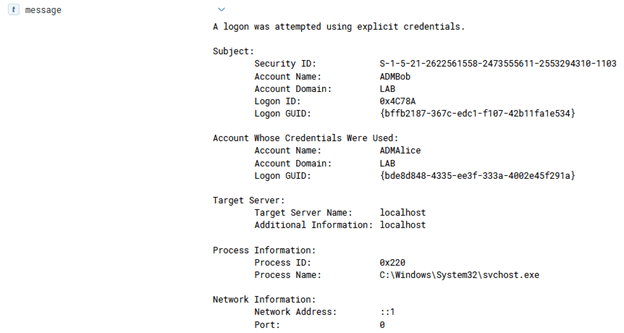
Next, a 4648 event will be created, notifying of a logon with explicitly provided credentials
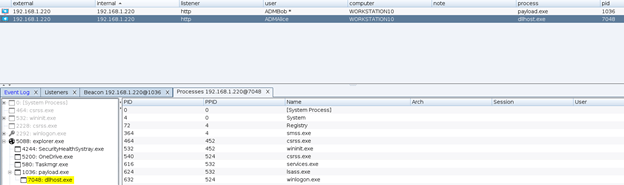
Then a new process will be created under that new session, which is whatever the spawnto process is set in the profile.

That process is now the beacon process for that logon session and user. It’s a child process of the original beacon’s process.
There are several techniques that were not covered in this post that are considered more “op-sec” friendly as they do not leave behind glaring obvious events behind like the ones covered so far. Some examples of these are:
- Beacon Object Files (BOF)
- Shinject
- API-Only calls such as
upload,mkdir,downloads, etc.
I do plan on covering detection for these in a later post.