
Over the years of penetration testing, red teaming, and teaching, I (and I’m sure a lot of others) are often asked how to get started in infosec. More specifically, how to become a pentester/red teamer or threat hunter/blue teamer. One of the things I always recommend is to build out a lab so you can test TTPs (techniques, tactics, procedures) and generate IOCs (indicators of compromise) so that you can understand how an attack works and what noise it generates, with the aim of being either to detect that attack or modify it so it’s harder to detect. It’s not really an opinion, but a matter of fact, that being a better blue teamer will make you a better red teamer and vice-versa. In addition, one of the things that I ask in an interview and have always been asked in an interview, is to describe what your home lab looks like. It’s almost an expectation as it is so crucial to be able to experiment with TTPs in a non-production environment. This post is aimed to help you create a home lab that will allow you to both do red team and blue team activity.
Hardware
One of the first questions that’s asked about a home lab is the cost. There’s a few ways to answer this.
- Host everything locally on your PC/laptop.
- Host everything on a dedicated server
- Host everything in the cloud
The other question is what is the necessary size of the lab? Home-labs do not have to replicate the size of an enterprise company. My home lab is setup as shown below, which is what will act as a template for this post.

In my person lab I run two Windows Servers and three Windows workstations. You could absolutely just have one server and one workstation, it’s just a matter of what you’re trying to accomplish. So, to answer the question of “what will it cost”, the answer is “it depends”. Personally I use a computer to act as a server which cost me about $400 to build which runs ESXI 7 to host all the VMs. Cloud could initially be cheaper, but in the long run it will probably cost more. I used to run everything locally on my work PC but I started to run out of disk space with all the VMs. As far as this guide goes, however you choose to host your VMs is up to you.
Hosting OS links:
Server Operating Systems:
Workstation Applications:
Cloud:
Architecture
How your lab is architected/laid out is a big deal. You want to mimic a real environment as much as possible which is why I suggest building a lab that runs Window’s Active Directory (AD). I don’t think I’ve been in an environment where AD was not being used. We will start by using Windows evaluation licenses.
And we will use Debian 10 to build an ELK (Elasticsearch, Logstash, Kibana) server.
Finally, for our attacking machine and for simplicity we will just use Kali
ELK Setup
Before setting up Windows, we will set up an ELK server. ELK (Elasticsearch, Logstash, Kibana) is a widely used platform for log processing. As a blue teamer, you want this because digging through logs is a key piece to threat hunting. As a red teamer, you want this to know what IOCs are generated from the TTPs you use.
Keep in mind this lab is meant to be for internal, private use only. The setup of these servers will not be secure and should not be used in a production environment.
Start off by downloading the Debian 10 ISO and then create a VM to boot off the ISO. I won’t go into the specifics on creating a VM as it’s platform specifics (e.g. VirtualBox, VMWare, etc.), but there’s a good article here for VMWare.
Once you install Debian and log in, you’ll want to first add your current user to the sudoers group. First, escalate to root:
sudo suThen add your user to the sudoers group.
sudo usermod -aG sudo [username]Then switch back to your user
su [username]Next, add the GPG key for the Elastic repository
wget -qO - https://artifacts.elastic.co/GPG-KEY-elasticsearch | sudo apt-key add -
And add the repository definition
echo "deb https://artifacts.elastic.co/packages/7.x/apt stable main" | sudo tee -a /etc/apt/sources.list.d/elastic-7.x.list
Now update apt
sudo apt-get update
And install logstash
sudo apt-get install logstash
Then Java
sudo apt-get install openjdk-11-jre
Then install Elasticsearch
sudo apt-get install elasticsearch
and finally Kibana
sudo apt-get install kibana
Next is to enable services
sudo /bin/systemctl enable elasticsearch.service && sudo /bin/systemctl enable kibana.service && sudo /bin/systemctl enable logstash.service
Before we start the services, there’s a few config changes we need to make.
sudo nano /etc/kibana/kibana.yml
Uncomment server.host and set the IP to 0.0.0.0 to listen on all interfaces and uncomment server.port. You can leave the port to 5601.

Save the file (ctrl+O, Enter, ctrl+x)
and now edit the elasticsearch config file
sudo nano /etc/elasticsearch/elasticsearch.yml
Set the network.host line to 0.0.0.0 and http.port to 9200

And add an additional line at the bottom
discovery.type: single-node

Save the file (ctrl+O, Enter, ctrl+x)
And start the services
sudo service logstash start
sudo service elasticsearch start
sudo service kibana start
Now if you browse to your Debian machine’s IP on port 5601 you should see Kibana.
ip addr


Windows Setup
Once again, I will not be showing how to deploy a VM as I want this post to be platform agnostic. So for setting up Windows, this will be under the impression you have stood up a Windows 2019 Server and Windows 10 machine.
In this section we will create an Active Directory lab by making a Domain Controller and Workstation.
Windows Server 2019
Once Server 19 is stood up, the first thing you should do is set a static IP. If you don’t, the machine’s IP can change which will break the environment. For reference, these are my settings.

The import part here is setting the DNS servers. The preferred DNS will be localhost (127.0.0.1) as we will install the DNS service on the machine in a moment. Then setting Google’s DNS server as a secondary so it can reach the internet (optional, completely OK if you do not want your lab to reach the internet).
Next, rename the server to something more conventional. I named mine PRIMARY as it will act as the primary domain controller in the environment.


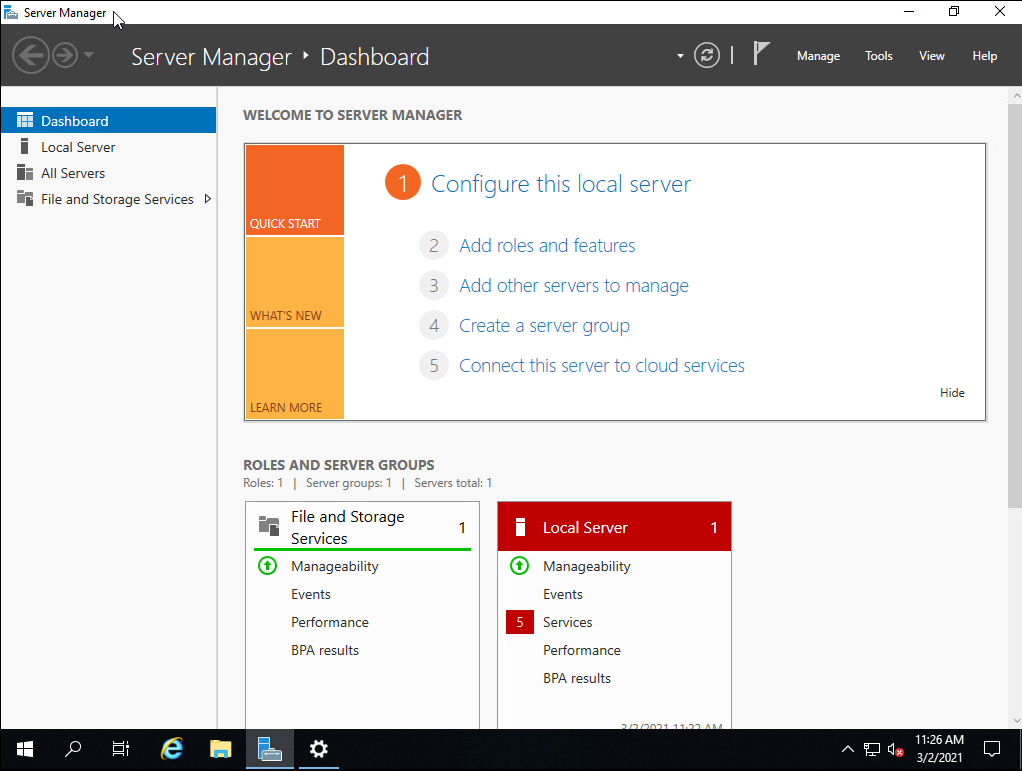
Reboot the server for the new settings to take effect. Once rebooted, you should have the server manager dashboard. Click on ‘Add roles and features’

Click next until you get to ‘Server Roles’. Add DNS and Active Directory Domain Servers

Click next until it asks for confirmation, then click install.

After it installs, the server dashboard will have a notification. Click on it and click ‘Promote this server to a domain controller’

Once you click promote, it will bring up another window. Click ‘Add a new forest’ and give the domain a name. I named mine ‘LAB.LOCAL’

Next, leave the default functional levels (Unless you’re adding a 2012, 2008, or 2003 server, then change it to those). Then set the DSRM password to something you’ll remember.

Click next until you get to the prerequisite check, then click ‘install’.

Once done, reboot the server.
Once rebooted, in the Server Dashboard, click on Tools>ADUC (Active Directory Users and Computers)

ADUC is used to manage users, groups, and computers (among other things). In this instance we just want to create a new user and assign them to the Domain Administrator role.
In ADUC, click on your domain on the left then select ‘Users’. At the top, click the icon shown below to create a new user.

Give them a name where you can identify them as an administrator by their name. Commonly in environments, they have ADM, ADMIN, -A, or some moniker to signify it’s a privileged account. Once created, right click on that user in ADUC and click ‘Add to a group’

Then type in ‘Domain Admins’ and select ‘OK’.

Once the user is added to the Domain Admins group, switch over to the Windows 10 workstation. Once again, I will assume the provisioning of the machine was already done and it is able to communicate with the domain controller. A simple test is to ping the Domain Controller’s IP and ensure they can talk to each other on the network.
On the Windows 10 machine, edit the DNS settings to include your Domain Controller’s IP address. Below is a shown example.

Click on the Windows icon, type in ‘join domain’ and open up ‘Access work or school’. Click on the ‘Connect’ button and then click ‘join this device to a local Active Directory domain’.

Enter the FQDN (Fully qualified domain name) of your domain and click ‘next’.

Note: If you get an error saying the domain was unable to be found, double check your DNS settings and ensure the Windows 10 machine can reach the Domain Controller.

You will then be prompted for credentials. This is where you will input your newly created Domain Administrator’s credentials.

Reboot the PC and it will then be joined to the domain.
Winlogbeat
Now that we have a workstation and domain controller as well as an ELK server, we need to configure our two Windows machines to send logs to the ELK server. To do this, we need a program called ‘Winlogbeat‘. In addition, I recommend also installing Sysmon. Download the .zip file for Winlogbeat and unzip it to a folder inside one of the Windows machines. Open a PowerShell window and navigate to the Winlogbeat directory in PowerShell. Run the following command
Set-ExecutionPolicy bypass
Select [a] when prompted
Then run the script
.\install-service-winlogbeat.ps1

Next, open “winlogbeat.yml” in Notepad. Copy+paste the following while changing the “hosts” IPs to match your ELK’s server IPs.
======================= Winlogbeat specific options ==========================
 winlogbeat.event_logs:
 name: Application
 ignore_older: 30m
 name: Security
 ignore_older: 30m
 name: System
 ignore_older: 30m
 name: Microsoft-windows-sysmon/operational
 ignore_older: 30m
 name: Microsoft-windows-PowerShell/Operational
 ignore_older: 30m
 event_id: 4103, 4104
 name: Windows PowerShell
 event_id: 400,600
 ignore_older: 30m
 name: Microsoft-Windows-WMI-Activity/Operational
 event_id: 5857,5858,5859,5860,5861
 output.elasticsearch:
   hosts: ["ELKIPHERE:9200"]
   username: "elastic"
   password: "changeme"
 setup.kibana:
   host: "ELKIPHERE"
Then start the winlogbeat service
Start-Service winlogbeat

Once the service is started you can verify that the connection works by running
.\winlogbeat setup -e

Click the drop down menu on the side and under ‘Analytics’ and go to ‘Discover’. You should now be seeing Windows logs.

Ensure that the time is synchronized properly within your lab as those are the times that will be reflected with the logs in Kibana. Otherwise, you can set your time filter to a different time.
Your basic detection lab is now ready to go! As said earlier, I recommend installing Sysmon on the Windows hosts to get detailed events out of them.
